


Quick answer
Adding the recipient's name to an email subject line increased opens from 9.05% to 10.80% and sales leads from 0.39% to 0.51% in the main experiment reported by Sahni and colleagues. In a separate test with 99,341 emails, adding an employer name only in the body increased leads while the open-rate difference was inconclusive.
Sahni, Wheeler and Chintagunta, Personalization in Email Marketing · Sahni, Wheeler and Chintagunta, Personalization in Email Marketing, Web Appendix
Key findings and sources
Subject-line personalization and open rates
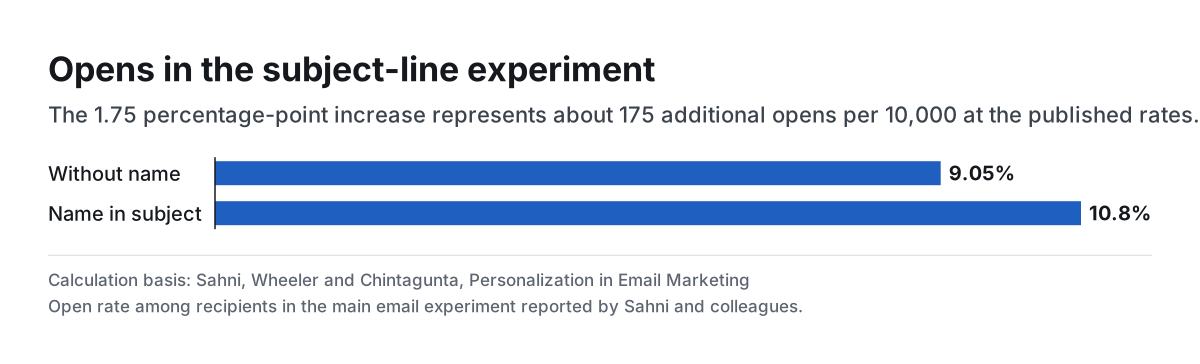
In the main experiment reported by Sahni, Wheeler and Chintagunta, a recipient name in the subject lifted opens from 9.05% to 10.80%, about 175 additional opens per 10,000 at the published rates.
Sahni, Wheeler and Chintagunta, Personalization in Email Marketing
Recipients in randomized commercial email field experiments; Field experiments reported in Marketing Science, 2018. Subtract the control rate from the treatment rate and scale to 10,000. The measure is opens.
Subject-line personalization and leads
The same subject-line experiment moved sales leads from 0.39% to 0.51%, approximately 12 additional leads per 10,000 and a 31% relative increase at the published rates.
Sahni, Wheeler and Chintagunta, Personalization in Email Marketing
Recipients in randomized commercial email field experiments; Field experiments reported in Marketing Science, 2018. Use the same randomized comparison and distinguish leads from sales.
Message-body personalization and leads
In a separate 99,341-email field experiment with identical subject lines, adding the recipient's employer to the body moved sales leads from 0.11% to 0.22% per send. That is about 11 additional leads per 10,000 sends at the published rates.
Sahni, Wheeler and Chintagunta, Personalization in Email Marketing, Web Appendix
99,341 sends in the separate Company C email experiment reported in the 2017 Web Appendix. Compare the lead rates for 49,836 treatment sends and 49,505 control sends in the authors' appendix.
Unsubscribes with employer name in the body
Company C's body-copy experiment reduced unsubscribes from 3.91% to 3.62% per send, about 29 fewer unsubscribes per 10,000 sends at the published rates. Its open-rate comparison had p = 0.30.
Sahni, Wheeler and Chintagunta, Personalization in Email Marketing, Web Appendix
99,341 sends in the separate Company C email experiment reported in the 2017 Web Appendix. Scale the rounded 0.29 percentage-point difference and read the p-value for the separate open-rate outcome.
Compare the results
Opens in the subject-line experiment
The 1.75 percentage-point increase represents about 175 additional opens per 10,000 at the published rates.
What 20% more opens means in a real inbox
Adding a recipient's name to the subject changed the open rate by 1.75 percentage points. At the reported rates, that is about 175 additional opens for every 10,000 recipients. In the same experiment, the 0.12-point gain in sales leads works out to about 12 additional leads at the same scale. Those outcomes answer different budget questions.
The lead-rate increase is roughly 31% in relative terms because the control rate was only 0.39%. A finance lead can use the absolute difference and a defensible value per incremental lead to judge whether the experiment mattered. A recovery team should replace leads with orders or contribution after offers and returns when it runs its own test.
When the name is visible after opening
Company C left the subject alone. The treatment added five words in the body that included the recipient's employer. The open rates were 10.99% in control and 10.79% in treatment, a difference with p = 0.30. Leads per email rose from 0.11% to 0.22%, and unsubscribes per email fell from 3.91% to 3.62%.
That is a useful example of a response changing after opening. It is also a different audience and a different text change from the main experiment. The estimated lead differences happen to be close on a common scale, about 12 versus 11 per 10,000. Treat the two results as reasons to measure both stages in a recovery test. The numbers cannot determine which placement would win on the same list.
Run the test around the shopper's task
For a cart recovery test, hold the sender, offer, delay and body constant if you want to isolate a subject line. If you want to know whether the body is more useful, keep the subject fixed and change a specific part of the message. A verified cart item, a delivery answer the shopper asked for or a link to the selected variant gives them something they can act on.
Keep a neutral fallback for missing or suspicious names, and measure the test by all assigned shoppers. Open data can help explain what happened, but order rate, contribution, replies and opt-outs decide whether to keep the change. In a low-volume store, test a single meaningful copy decision before splitting into many narrowly defined audiences.
Study data
| Measure | Value |
|---|---|
| Main experiment / opens, control | 9.05% |
| Main experiment / opens, recipient name in subject | 10.8% |
| Main experiment / sales leads, control | 0.39% |
| Main experiment / sales leads, recipient name in subject | 0.51% |
| Main experiment / unsubscribes, control | 1.2% |
| Main experiment / unsubscribes, recipient name in subject | 1% |
| Measure | Value |
|---|---|
| Company C / emails sent | 99,341 emails |
| Company C / company-name arm emails sent | 49,836 emails |
| Company C / control arm emails sent | 49,505 emails |
| Company C / opens, control | 10.99% |
| Company C / opens, company name in body | 10.79% |
| Company C / sales leads, control | 0.11% |
| Company C / sales leads, company name in body | 0.22% |
| Company C / unsubscribes, control | 3.91% |
| Company C / unsubscribes, company name in body | 3.62% |
| Company C / leads per open, control | 1.01% |
| Company C / leads per open, company name in body | 2.08% |
| Company C / open rate comparison p-value | 0.3 p-value |
| Company C / unsubscribes per open, control | 35.52% |
| Company C / unsubscribes per open, company name in body | 33.56% |
What changes when you compare the figures
| Comparison | Result | Calculation |
|---|---|---|
| Additional opens per 10,000, subject-line test | 175.0 opens | = (10.80-9.05)*100 |
| Additional leads per 10,000, subject-line test | 12.0 leads | = (0.51-0.39)*100 |
| Fewer unsubscribes per 10,000, subject-line test | 20.0 unsubscribes | = (1.2-1.0)*100 |
| Additional leads per 10,000, body-copy test | 11.0 leads | = (0.22-0.11)*100 |
| Fewer unsubscribes per 10,000, body-copy test | 29.0 unsubscribes | = (3.91-3.62)*100 |
| Relative change in leads per send, subject-line test | 30.769231% | = (0.51/0.39-1)*100 |
| Relative change in opens, subject-line test | 19.337017% | = (10.8/9.05-1)*100 |
| Relative change in leads per send, body-copy test | 100.0% | = (0.22/0.11-1)*100 |
Methodology and sources
Re-read the main experiment rates in the publisher abstract and the Company C rates and arm sizes in the authors' Web Appendix. Subtract the control from treatment within the same experiment and multiply percentage-point differences by 100 to express them per 10,000 sends. Use the published rounding. The two experiments changed different text in different populations.
Download the source data (CSV)
Download the calculations (CSV)
Download the citation notes (CSV)
Related reading
Email spam complaint rate statistics and thresholds for recovery campaigns
Abandoned cart email statistics and how to read revenue per recipient
Cart recovery SMS benchmarks for conversion and unsubscribes
Email open rate statistics and what Mail Privacy Protection changes
Send a Shopify checkout recovery link that opens the right cart
Sources and definitions
Sahni, Wheeler and Chintagunta, Personalization in Email Marketing
Sahni, Wheeler and Chintagunta, Personalization in Email Marketing, Web Appendix
The source data includes the population, period, denominator and limitations for every figure.