


Quick answer
Klaviyo’s 2026 abandoned-cart report recorded $6.77 per recipient for the average cart email flow and $13.70 for the top group. The average cart flow led welcome by $1.02 per recipient, while the lead in the top group narrowed to $0.43. Omnisend separately reported $2.87 per send across all automated email versus $0.18 for scheduled campaigns in its 2025 data. Recipient and send are different units, and all of these are attributed results.
Klaviyo 2026 Abandoned Cart Benchmark Report · Omnisend, 2026 Ecommerce Marketing Report
Key findings and sources
Average and top-performing cart email revenue
Klaviyo’s October 2026 benchmark, based on analysis across more than 110,000 platform customers overall, lists $6.77 in attributed revenue per recipient for the average abandoned cart email flow and $13.70 for its top-performing group.
Klaviyo 2026 Abandoned Cart Benchmark Report
Cart and welcome revenue gap narrowed at the top
In Klaviyo’s October 2026 report, abandoned cart and welcome email averaged $6.77 and $5.75 in revenue per recipient. The reported top groups recorded $13.70 and $13.27, a $0.43 difference compared with $1.02 at the average.
Klaviyo 2026 Abandoned Cart Benchmark Report
Industry click rates can reverse the cart and browse order
Klaviyo’s October 2026 study reports 6.5% average clicks for cart email versus 5.8% for browse in home and garden. In automotive, the corresponding averages were 5.7% and 6.0%. Per-industry flow counts are not provided in the report.
Klaviyo 2026 Abandoned Cart Benchmark Report
Automation sends and revenue in Omnisend’s 2025 sample
Omnisend’s 2026 report, covering 2025 data from 150,000 brands and 27 billion emails, attributes 30% of email revenue to automations, which comprised 2% of sends. Automated and scheduled emails averaged $2.87 and $0.18 per send across their respective message groups.
Omnisend, 2026 Ecommerce Marketing Report
Order concentration across two automated flows
Omnisend’s 2026 report attributes 76% of 2025 automation-generated orders to abandoned cart and welcome emails combined. This is a share of orders attributed to automations, not a percentage of all ecommerce orders.
Omnisend, 2026 Ecommerce Marketing Report
Top-decile abandoned cart email revenue by industry
Klaviyo’s 2026 report cites top-decile abandoned cart email revenue per recipient of $35.24 for hardware and home improvement, $28.76 for home and garden, $27.48 for automotive and $24.72 for electronics. The benchmark covers selected top-performing groups and does not report each industry’s underlying sample size alongside the figures.
Klaviyo 2026 Abandoned Cart Benchmark Report
The top-decile cart-browse gap is larger in dollars
In Klaviyo’s 2026 benchmarks, cart email revenue per recipient exceeded browse abandonment by $4.69 at the average and $9.38 at the top-decile level. The corresponding ratios were 3.25 and 3.17. These compare published flow aggregates, not paired senders or causal effects.
Klaviyo 2026 Abandoned Cart Benchmark Report
Recipient volume can outweigh the per-recipient ranking
At Klaviyo’s 2026 attributed revenue-per-recipient averages, post-purchase email would require 3.76 times the cart flow’s recipient count to match its total attributed revenue at fixed rates, and win-back would require 8.26 times as many.
Klaviyo 2026 Abandoned Cart Benchmark Report
Omnisend’s reported aggregate shares imply a different ratio from its dollar rows
Omnisend’s rounded 2% of sends and 30% of revenue imply a 21.00-times automated-to-scheduled revenue-per-send ratio if pooled on one partition. Its $2.87 and $0.18 per-send rows imply 15.94 times.
Omnisend, 2026 Ecommerce Marketing Report
Omnisend 2026 report, automation and scheduled email summaries; a conditional arithmetic reconciliation. Compare automated and scheduled revenue shares divided by their send shares. Separately divide the two published dollar rows.
A common-pool reconciliation implies an automation send share of 2.62%
Using Omnisend’s 30% revenue share and the reported $2.87 versus $0.18 per-send ratio as exact common-pool inputs yields an implied automated send share of 2.62%. That is a conditional reconstruction, not another published share.
Omnisend, 2026 Ecommerce Marketing Report
Omnisend 2026 report email summaries, worked common-pool assumption. Solve revenue share = automated rate times its send share divided by the combined weighted rate.
Compare the results
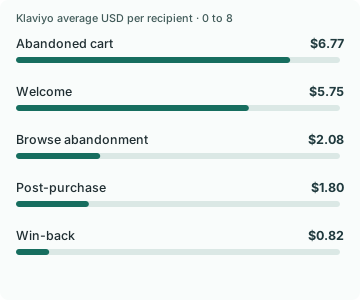
Cart email led welcome on revenue, but the gap narrowed among top performers
In the Klaviyo chart, cart led welcome by $1.02 at the average, $6.77 versus $5.75 per recipient. Among the top performers shown for each flow, the gap was just $0.43, $13.70 versus $13.27. Welcome had the higher click rate at both reported levels: 6.5% versus 6.0% at the average and 13.3% versus 11.3% among top performers. The money and engagement columns can lead to different investment decisions.
Use the flow’s job to set the comparison. A welcome flow reaches people who just signed up. Cart flow reaches people who left an item in a cart. The top-decile numbers describe the vendor’s best-performing groups and do not follow the same brand from one flow into the other. A smaller gap at the top gives a reason to audit the welcome flow before adding another cart email. It does not quantify the gain the audit will find.
In some industries, browse earns a separate look
Klaviyo reported a 0.7 percentage-point cart-over-browse click advantage in home and garden, 6.5% versus 5.8%. The direction reversed in automotive, at 5.7% for cart and 6.0% for browse. Hardware and home improvement was nearly even, 6.4% versus 6.5%. The industry comparisons describe click rate only. An extra click can lead to research, a repair question, a compatible part, or a purchase, depending on the buying journey.
Inspect the path after the click before using the automotive result to move budget. If the customer repeatedly browses products that require a compatibility decision, a message that answers that question may help more than a generic reminder. A cart event may arrive after the question was already resolved. For your own analysis, hold the attribution window and eligibility rule steady and report placed orders alongside clicks. Include the number of recipients so a tiny segment cannot win on a noisy rate alone.
Two platform reports answer different questions about message frequency
In Omnisend’s 2025 data, automations accounted for 2% of email sends and 30% of attributed email revenue. Its report lists $2.87 per automated send versus $0.18 per scheduled send and attributes 76% of automation-generated orders to cart and welcome messages combined. The per-send numbers include automation types beyond checkout recovery. They describe where the platform recorded orders and revenue across its merchant base.
Suppose 100 shoppers receive 300 messages that collectively carry $300 in attributed sales. That is $3 per recipient or $1 per send. If the same people generate $300 of attributed sales after 100 messages, revenue per recipient stays $3 while revenue per send rises to $3. That can still be valuable if message cost or customer fatigue falls, but the change says nothing by itself about new demand. Report recipients and sends together when you change the number of reminders.
Reconcile recovered revenue with what was actually recovered
Start with a fixed cohort of shoppers who were eligible under a documented trigger. Count unique shoppers, sends, and attributed orders independently. If a cart and a welcome flow can both claim the same order, reconcile the two claims to the order ID before adding them together. Check whether the retailer includes shipping, tax, returns or canceled orders in reported revenue. Treat different platform lookback windows and reporting rules as measurement differences before diagnosing an underperforming flow.
If you change eligibility, send frequency or offer value, compare the old and new schedules at the level of the originally eligible shopper. Keep successful purchases that occurred before a queued send. Record opt-outs and refunds. Run a no-message or existing-policy holdout when the decision depends on additional purchases or profit. The benchmarks can help you decide which flow to inspect and what to measure. A randomized comparison answers whether more of those shoppers bought because of the change.
Compare with the right industry before chasing a top-decile target
Klaviyo reports $13.70 in revenue per recipient for the overall top-performing 10% of abandoned cart email flows. Among selected industries, its published figures are $35.24 in hardware and home improvement, $28.76 in home and garden, $27.48 in automotive and $24.72 in electronics. The gap between the highest and lowest of those four displayed figures is $10.52 per recipient. These are selected groups within different industries, with no sample size for each value shown beside the results.
A high industry benchmark gives a merchant a reference point for investigation. Before setting a target, reconcile order values, attributed purchase rates, discount rates and the mix of recipients. A hardware flow can report higher revenue per recipient even if it has fewer buyers, because it may sell higher-priced products. Use your own comparable segment and report revenue and contribution over a consistent window. For a rollout decision, compare assigned shoppers with a holdout so the assessment includes people who would have ordered without the email.
Why the cart advantage looks different in dollars and ratios
Klaviyo’s published average revenue per recipient is $6.77 for abandoned cart email and $2.08 for browse abandonment. That is a $4.69 gap and about 3.25 times the browse figure. The top-decile figures are $13.70 and $4.32. Their $9.38 gap is twice the average dollar gap, while the ratio is about 3.17 times. Using one scale rather than the other changes how large the difference sounds.
These are separate flow benchmarks. The top-decile cart group and the top-decile browse group need not consist of the same senders. The figures do not imply that switching a browse shopper to a cart email would produce the gap. The recipient pools are already at different points in the shopping journey.
A lifecycle lead can use the two scales without confusing them. The ratio answers how much higher one reported rate is relative to the other. The dollar gap shows the difference on the same per-recipient unit and is useful when making a planning comparison with a clearly specified number of eligible people. For a rollout decision, add unique entrants, overlap, send rules and orders already completed before either message. If both flows claim a sale, deduplicate it before estimating overall impact and keep a holdout to measure what the flows added.
Use recipient volume before comparing total flow revenue
Klaviyo’s average attributed revenue per recipient was $6.77 for cart email, $1.80 for post-purchase email and $0.82 for win-back. Holding those rates fixed for an illustration, post-purchase email would need 3.76 times the number of recipients to match the cart flow’s total attributed revenue. Win-back would need 8.26 times as many. The arithmetic helps separate a flow’s rate from the number of people who are eligible for it.
Imagine a store with 1,000 cart-flow recipients during a month. At the source average, the worked total is $6,770 attributed to the cart flow. A post-purchase series at the source rate would reach the same attributed total at roughly 3,761 recipients. That example does not estimate either flow’s effect. It gives the lifecycle team a quick way to see whether the real constraint is a small eligible pool or a low result per recipient.
If you’re choosing where to spend a week, rank the candidates using reachable volume, missed eligibility, a realistic change in incremental value per eligible recipient, and the effort required. Keep post-purchase and win-back windows distinct, since a reorder and a recovered checkout have different clocks. Evaluate a flow change against its own eligible holdout and report repeat orders or retained contribution where those outcomes matter.
Two figures in the same report can imply different ratios
Omnisend’s report says automated email made up 2% of sends and 30% of email revenue. If those rounded shares described an exhaustive partition and were pooled in the same way, automated revenue per send would be 21.00 times scheduled revenue per send: divide 30 by 2 and compare that with 70 divided by 98. The directly displayed dollar rows, $2.87 and $0.18 per send, instead give 15.94 times.
This is a reconciliation test, not evidence that either reported summary is wrong. Published shares are rounded, and an average of account-level rates can differ from a pooled ratio. If 30% were exact and the $2.87-to-$0.18 ratio applied to the same pooled population, the implied send share would be about 2.62%. The public summaries alone do not establish which aggregation choices explain the gap.
Ask for the same numerator and denominator before making a cross-platform comparison. Revenue per recipient, revenue per send and revenue per delivered message can all produce different rates when a flow sends several times to one person. Record the denominator used by the dashboard and quote it wherever the rate appears.
Show the exact aggregation before moving budget between flows
Start with total delivered messages and attributed revenue for each flow within the same reporting window. Decide whether the rate is pooled across all recipients or averaged across stores, and disclose the count and treatment of repeated recipients. A small store and a large store contribute equally to a simple store average but very differently to a pooled rate. Report the same approach before and after a cadence change.
A store deciding whether to add a cart message needs a holdout-based estimate of paid orders and contribution per eligible recipient. The platform ratios help decide what to examine first. If a reconciliation depends on counting the same order for several flows or on using different windows, keep the figures as separate summaries and resolve the overlap before treating their difference as opportunity.
A flow can outperform on attributed revenue while adding little incremental revenue if it reaches shoppers who would buy anyway. Compare the same eligible customer policy with and without the additional message. Then check whether the ranking still holds after deducting promo costs, returns and the orders observed in the holdout.
The flow with more clicks can have less revenue per recipient
Welcome email averaged 6.5% clicks and $5.75 revenue per recipient in the report. Cart recovery averaged 6.0% and $6.77. A new subscriber can click to browse, while the person returning to a cart already has a purchase in mind. The difference gives you a reason to inspect funnel intent before changing subject lines or delivery frequency.
Open a cart that has received the email and check the actual destination. If it opens a stale or empty cart, improving the message may generate more clicks without helping shoppers finish. Trace the landing page, item availability, amount payable and final checkout before choosing the next experiment.
Use revenue per recipient with its original base
Suppose a report attributes $800 to 400 recipients. It shows $2 per recipient under that report’s rules. If 600 people entered the flow and 200 were suppressed, the same revenue spread over all entrants is $1.33 per entrant. Both rates can be useful and they answer different questions.
Write down whether your denominator is unique recipients, flow entrants or sends. Then record which events claim an order and how long after the message they may do so. A benchmark can help identify an unusual result only when the compared metrics use similar rules.
A high attributed number still needs a control
A shopper may see a recovery email and then complete an order they intended to place anyway. They may also receive a text or see an ad before purchasing. Keep attribution for reporting what your platforms observed, and use random assignment or a suitable controlled test for a causal decision.
An apparent improvement is worth investigating when the same report shows better click-to-checkout continuity, more valid purchases or stronger contribution. If only the attribution window changed, recalculate the original period under the new rule before drawing a conclusion.
Study data
| Measure | Value | Context |
|---|---|---|
| Abandoned cart email, average revenue per recipient | $6.77 | Reported average |
| Abandoned cart email, top-decile revenue per recipient | $13.70 | Top 10% of brands |
| Browse abandonment email, average revenue per recipient | $2.08 | Reported average |
| Welcome email, average revenue per recipient | $5.75 | Reported average |
| Abandoned cart email, average click rate | 6.0% | Reported average |
| Abandoned cart email, top-decile click rate | 11.3% | Top 10% of brands |
| Welcome email, average click rate | 6.5% | Reported average |
| Browse abandonment email, top-decile revenue per recipient | $4.32 | Top-performing 10%. |
| Welcome email, top-decile revenue per recipient | $13.27 | Top-performing 10%. |
| Post-purchase email, average revenue per recipient | $1.80 | Reported average. |
| Post-purchase email, top-decile revenue per recipient | $2.77 | Top-performing 10%. |
| Win-back email, average revenue per recipient | $0.82 | Reported average. |
| Win-back email, top-decile revenue per recipient | $1.60 | Top-performing 10%. |
| Browse abandonment email, average click rate | 5.6% | Reported average. |
| Welcome email, top-decile click rate | 13.3% | Top-performing 10%. |
| Home and garden cart email, average click rate | 6.5% | Industry-specific reported average. |
| Home and garden browse email, average click rate | 5.8% | Industry-specific reported average. |
| Hardware and home improvement cart email, average click rate | 6.4% | Industry-specific reported average. |
| Hardware and home improvement browse email, average click rate | 6.5% | Industry-specific reported average. |
| Automotive cart email, average click rate | 5.7% | Industry-specific reported average. |
| Automotive browse email, average click rate | 6.0% | Industry-specific reported average. |
| Measure | Value | Context |
|---|---|---|
| Share of Omnisend email sends from automations | 2% | Aggregate across automation types. |
| Share of Omnisend email revenue from automations | 30% | Aggregate across automation types. |
| Omnisend automated email revenue per send | $2.87 | Aggregate across automation types. |
| Omnisend scheduled email revenue per send | $0.18 | Aggregate across campaigns. |
| Omnisend automation orders from cart and welcome combined | 76% | Combined attributed orders across the two flows. |
| Measure | Value | Context |
|---|---|---|
| Hardware and home improvement cart email, top-decile revenue per recipient | $35.24 | Klaviyo’s published top-decile value for abandoned cart email |
| Home and garden cart email, top-decile revenue per recipient | $28.76 | Klaviyo’s published top-decile value for abandoned cart email |
| Automotive cart email, top-decile revenue per recipient | $27.48 | Klaviyo’s published top-decile value for abandoned cart email |
| Electronics cart email, top-decile revenue per recipient | $24.72 | Klaviyo’s published top-decile value for abandoned cart email |
What changes when you compare the figures
| Comparison | Result | Calculation |
|---|---|---|
| Top-decile cart email revenue per recipient relative to the average | 2.02 times | = 13.70 ÷ 6.77 |
| Average welcome email click-rate lead over cart email | 0.5 percentage points | = 6.5 − 6.0 |
| Average cart minus welcome email revenue per recipient | $1.02 | = 6.77 - 5.75 |
| Top-decile cart minus welcome email revenue per recipient | $0.43 | = 13.70 - 13.27 |
| Home and garden cart minus browse email click rate | 0.7 percentage points | = 6.5 - 5.8 |
| Automotive cart minus browse email click rate | -0.3 percentage points | = 5.7 - 6.0 |
| Omnisend automated versus scheduled email revenue per send | 15.94 times | = 2.87 / 0.18 |
| Highest minus lowest reported industry top-decile cart email revenue per recipient | 10.52 USD per recipient | = 35.24 - 24.72 |
| Hardware and home improvement versus overall cart email top-decile revenue per recipient | 2.57 times | = 35.24 / 13.70 |
| Cart minus browse average revenue per recipient | 4.69 USD per recipient | = 6.77 - 2.08 |
| Cart minus browse top-decile revenue per recipient | 9.38 USD per recipient | = 13.70 - 4.32 |
| Top-decile cart-browse dollar gap divided by average gap | 2 times | = (13.70 - 4.32) / (6.77 - 2.08) |
| Average cart revenue per recipient relative to browse | 3.25 times | = 6.77 / 2.08 |
| Top-decile cart revenue per recipient relative to browse | 3.17 times | = 13.70 / 4.32 |
| Post-purchase recipients needed per cart recipient at source averages | 3.76 times | = 6.77 / 1.80 |
| Win-back recipients needed per cart recipient at source averages | 8.26 times | = 6.77 / 0.82 |
| Illustrative attributed cart revenue from 1,000 recipients | $6,770.00 | = 1000 * 6.77 |
| Illustrative post-purchase recipients needed to match the cart total | 3,761.11 recipients | = 1000 * 6.77 / 1.80 |
| Automated versus scheduled revenue-per-send ratio implied by rounded aggregate shares | 21.0 times | = (30 / 2) / (70 / 98) |
| Reported automated versus scheduled per-send ratio from dollar rows | 15.94 times | = 2.87 / 0.18 |
| Gap between the two revenue-per-send reconstructions | 5.06 times | = (30 / 2) / (70 / 98) - 2.87 / 0.18 |
| Automation send share implied by 30% revenue and the dollar ratio under identical pooling | 2.62% | = 0.30 / ((2.87 / 0.18) * 0.70 + 0.30) * 100 |
Methodology and sources
Klaviyo reports analyzing more than 110,000 customers across industries. We transcribed email figures from its flow charts. The displayed top-decile abandoned cart revenue per recipient is about 2.02 times the displayed average, calculated as 13.70 divided by 6.77. The exact count of flows behind each aggregate is not given alongside it. The dataset reflects Klaviyo customers and provider attribution.
We transcribed Klaviyo’s email revenue-per-recipient chart, email click-rate chart and industry comparisons from the October 2026 benchmark. Klaviyo reports analysis across more than 110,000 platform customers overall; it does not publish the sample beside each flow or top-decile row. We retain average and top group as distinct observations and compute gaps only between the published rounded values.
Omnisend’s 2026 report covers 2025 activity, including 27 billion emails from a report covering 150,000 brands. Its automation figures cover all types of automation unless explicitly labeled cart and welcome. Its revenue per send uses messages as the denominator. We preserve that unit and do not pool it with Klaviyo revenue per recipient. Neither study estimates the additional purchases that email caused.
Download the source data (CSV)
Download the calculations (CSV)
Related reading
Cart recovery SMS benchmarks for conversion and unsubscribes
Email open rate statistics and what Mail Privacy Protection changes
Abandoned cart email inbox placement statistics by mailbox provider
Send a Shopify checkout recovery link that opens the right cart
Sources and definitions
Klaviyo, 2026 Abandoned Cart Benchmark Report
Omnisend, 2026 Ecommerce Marketing Report
The source data includes the population, period, denominator and limitations for every figure.