


Quick answer
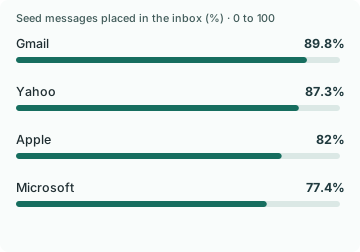
In Validity’s 2025 seed-email tests, inbox placement was 89.8% for Gmail and 77.4% for Microsoft, a 12.4 percentage-point gap. Microsoft’s test row had 8.7 more points of spam placement and 3.7 more points missing than Gmail’s. A brand whose recovery results drop at one mailbox provider should check actual placement before judging its copy or offer.
Key findings and sources
Gmail and Microsoft differed by 12.4 inbox points
In Validity’s 2025 seed-message data, Gmail placed 89.8% of tested messages in the inbox and Microsoft placed 77.4%, a 12.4 percentage-point difference in the reported provider rows.
Validity 2026 Email Deliverability Benchmark Report
Spam accounted for most of the reported inbox gap
Validity’s Microsoft row reported 15.1% spam and 7.5% missing, versus 6.4% and 3.8% for Gmail. The differences were 8.7 and 3.7 points, respectively. The spam-placement difference accounted for about 70.2% of the 12.4-point inbox gap.
Validity 2026 Email Deliverability Benchmark Report
Yahoo and Apple had different placement profiles
Validity’s 2025 seed data put Yahoo inbox placement at 87.3% with 6.4% spam, and Apple at 82.0% with 10.8% spam. These rows describe vendor seed tests.
Validity 2026 Email Deliverability Benchmark Report
Provider mix can change the aggregate without a provider decline
Using the same two Validity 2025 provider rates, a hypothetical 80% Gmail and 20% Microsoft mix gives 87.32% inbox placement. The reverse mix gives 79.88%, a 7.44-point difference without a change to either provider rate.
Validity 2026 Email Deliverability Benchmark Report
The Yahoo-Gmail inbox gap matched the missing gap in the benchmark
Validity’s 2025 seed test rows gave Gmail and Yahoo identical spam placement of 6.4%. Yahoo’s 6.3% missing rate exceeded Gmail’s 3.8% by 2.5 points, matching the reported inbox placement gap.
Validity 2026 Email Deliverability Benchmark Report
Validity 2025 seed messages, Gmail and Yahoo provider-specific placement rows. Compare the three destination shares within each provider and subtract the two missing rates.
Eliminating the missing share alone would fall short of a worked 85% target
In a worked scenario using Validity’s Microsoft row, moving all 7.5% of missing messages into the inbox would raise inbox placement from 77.4% to 84.9%, with spam placement unchanged.
Validity 2026 Email Deliverability Benchmark Report
Worked scenario using Validity’s 2025 Microsoft seed-placement percentages. Add the reported missing share to the reported inbox share while holding spam fixed.
Compare the results
A send can be accepted and still miss the inbox
When recovered orders drop, it is tempting to rewrite the subject line or add a discount. First ask which recipients got a chance to read the message. Accepted mail may land in spam, and an aggregate delivery metric cannot tell you the folder. The publisher also tracks messages classified as missing from its tests. That status is distinct from a confirmed spam placement.
Validity’s four large-provider rows span 77.4% to 89.8% inbox placement. Between Microsoft and Gmail, the difference corresponds to 1,240 inbox placements per 10,000 equally sized test-message sets. The same comparison shows 8.7 points more spam placement and 3.7 points more missing mail in the Microsoft row. The relative contribution of these two observations suggests different diagnostic paths, even when both affect inbox reach.
Changing provider mix can move the headline
Imagine two brand reports with the same provider-specific placement rates. If the first has 80% Gmail and 20% Microsoft addresses and the second has the opposite mix, weighting the benchmark rates gives 87.32% and 79.88%. The aggregate moves 7.44 points with nothing changing inside either provider.
That worked example uses only two providers and public seed rates. It is not a forecast for either brand. The useful check is to compare the same mailbox provider over time and identify shifts in your reachable mix. Keep providers with too few observations grouped or show the count, rather than treating a small slice as a precise performance reading.
Diagnose placement and purchase separately
For each recovery step, record eligible recipients, attempts, accepted messages and known bounces by mailbox provider. Use a seed test to check actual placement in each provider rather than assigning a folder based on opens. If the problem is limited to one provider, inspect the messages that changed, the affected stream and your authenticated sending setup before changing the whole flow.
When placement is stable and only purchases have moved, look at the transition from landing page to valid paid order. Use a randomized eligible holdout if the question is whether the recovery email adds orders. Keep the holdout denominator fixed. Inbox placement helps diagnose access to the message; it is not the right denominator for the incremental effect of assigning it.
An identical spam rate can hide a different placement problem
Validity’s 2025 seed test results gave Gmail and Yahoo the same 6.4% spam placement. Yahoo’s missing rate was 6.3%, compared with Gmail’s 3.8%. That 2.5-point difference equals the 2.5-point inbox-placement gap in the two published rows. One pooled non-inbox number would show a gap, while the breakdown tells a team where the two reports differ.
Use the outcome labels precisely. Missing means the test did not find the message in the inbox or spam folder under the benchmark method. A test cannot establish the specific cause of every missing message. A retailer should inspect its sending logs and mailbox-specific evidence before interpreting a missing result as a rejection, deferral or filtering event.
If the provider sample is small, show the counts along with the placement percentages. Two similar percentage changes can represent very different amounts of evidence. Keep the same list mix when testing authentication, volume or content changes, or report provider results individually so a composition shift does not conceal a provider-level decline.
Set a placement target against a particular route to improvement
In a worked example, suppose Microsoft inbox placement starts at the benchmark 77.4% and the target is 85%. Even moving the entire 7.5% missing share into the inbox would reach only 84.9% if spam stayed fixed. If missing stayed fixed, moving about 50.33% of the 15.1% spam share into the inbox would reach the target. These are arithmetic scenarios, not expectations for a particular technical change.
Follow both outcomes through a before-and-after check for the same provider and sending conditions. If the tested inbox gain is accompanied by a fall in spam and missing stays stable, the pattern supports one diagnosis. If missing moves more than spam, it supports another investigation. Keep verified placement, valid clicks and paid orders as separate outcomes so gains in one measure can be checked against the customer outcome.
An inbox gain only shows the message reached the measured destination. It gives the merchant a chance to solve the checkout issue, but a broken link or expired promotion can still leave purchase unchanged. Pair the technical test with a small check that the destination and saved cart actually match the customer’s message.
Study data
| Measure | Value | Context |
|---|---|---|
| Gmail inbox placement | 89.8% | Share of test messages in the reported category |
| Gmail spam placement | 6.4% | Share of test messages in the reported category |
| Gmail missing placement | 3.8% | Share of test messages in the reported category |
| Microsoft inbox placement | 77.4% | Share of test messages in the reported category |
| Microsoft spam placement | 15.1% | Share of test messages in the reported category |
| Microsoft missing placement | 7.5% | Share of test messages in the reported category |
| Yahoo inbox placement | 87.3% | Share of test messages in the reported category |
| Yahoo spam placement | 6.4% | Share of test messages in the reported category |
| Yahoo missing placement | 6.3% | Share of test messages in the reported category |
| Apple inbox placement | 82% | Share of test messages in the reported category |
| Apple spam placement | 10.8% | Share of test messages in the reported category |
| Apple missing placement | 7.2% | Share of test messages in the reported category |
| Overall inbox placement | 87.2% | Reported global inbox placement |
What changes when you compare the figures
| Comparison | Result | Calculation |
|---|---|---|
| Gmail minus Microsoft inbox placement | 12.4 percentage points | = 89.8 - 77.4 |
| Microsoft minus Gmail spam placement | 8.7 percentage points | = 15.1 - 6.4 |
| Microsoft minus Gmail missing rate | 3.7 percentage points | = 7.5 - 3.8 |
| Spam’s share of the Microsoft versus Gmail non-inbox difference | 70.16% | = (15.1 - 6.4) / (89.8 - 77.4) * 100 |
| Inbox placement gap per 10,000 test messages | 1,240 test messages | = (89.8 - 77.4) / 100 * 10000 |
| Hypothetical placement with an 80% Gmail list | 87.32% | = 0.8 * 89.8 + 0.2 * 77.4 |
| Hypothetical placement with an 80% Microsoft list | 79.88% | = 0.2 * 89.8 + 0.8 * 77.4 |
| Hypothetical placement difference from provider mix alone | 7.44 percentage points | = (0.8 * 89.8 + 0.2 * 77.4) - (0.2 * 89.8 + 0.8 * 77.4) |
| Yahoo minus Gmail spam placement | 0.0 percentage points | = 6.4 - 6.4 |
| Yahoo minus Gmail missing placement | 2.5 percentage points | = 6.3 - 3.8 |
| Inbox placement if all Microsoft missing test messages moved to inbox | 84.9% | = 77.4 + 7.5 |
| Share of Microsoft spam needed to move to inbox to hit a worked 85% target | 50.33% | = (85 - 77.4) / 15.1 * 100 |
Methodology and sources
Use the publisher’s 2025 provider rows on report pages 17 to 20. Subtract paired percentages by outcome, and convert the inbox gap to a difference per 10,000 test messages. In the illustrative two-provider example, apply the same source rates to two explicitly hypothetical list mixes. This illustrates aggregation only. It is not a forecast, and publisher seed placement can differ from a recipient’s inbox.
Download the source data (CSV)
Download the calculations (CSV)
Related reading
Abandoned cart email statistics and how to read revenue per recipient
Cart recovery SMS benchmarks for conversion and unsubscribes
Email open rate statistics and what Mail Privacy Protection changes
Send a Shopify checkout recovery link that opens the right cart
Sources and definitions
Validity 2026 Email Deliverability Benchmark Report
The source data includes the population, period, denominator and limitations for every figure.