


Quick answer
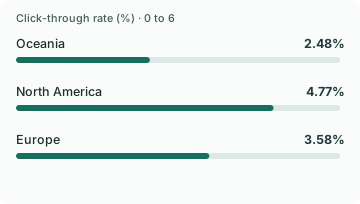
GetResponse’s 2024 report analyzed more than 4.4 billion messages sent in 2023. Oceania reported 55.66% opens and 2.48% clicks, while North America reported 45.30% opens and 4.77% clicks. The region with more recorded opens had fewer reported clicks per message. Apple Mail can load remote content even without engagement.
Key findings and sources
Where the opens and clicks ranking reversed
In GetResponse’s 2024 report on 2023 messages, Oceania reported 55.66% opens and 2.48% clicks, while North America reported 45.30% opens and 4.77% clicks. Oceania led on recorded opens by 10.36 points and trailed on clicks by 2.29 points. The sample counts repeat activity.
GetResponse, 2024 Email Marketing Benchmarks
Why a remote image load is ambiguous
Apple says Protect Mail Activity downloads remote content in the background by default, regardless of whether the recipient engages with the email. A recorded pixel load therefore does not establish a human read when that feature applies.
The annual comparison depends on the scale
GetResponse reported a 12.84-point annual increase in opens and a 1.36-point increase in clicks. Relative to the prior levels implied by those figures, the increases were 47.91% and 71.96%. These are comparisons of reported provider aggregates.
GetResponse, 2024 Email Marketing Benchmarks
Triggered and newsletter metrics use different message groups
GetResponse’s 2023 platform sample reported 45.38% opens and 5.02% clicks for triggered emails, versus 40.08% opens and 3.84% clicks for newsletters. The figures are descriptive and do not isolate a causal effect of a trigger.
GetResponse, 2024 Email Marketing Benchmarks
What the email benchmark counted
GetResponse’s 2024 report analyzed more than 4.4 billion messages sent in 2023 and included active senders with at least 500 contacts. The methodology counts repeat opens and multiple link clicks, so its reported rates are not unique-person measures.
GetResponse, 2024 Email Marketing Benchmarks
Trigger differences were larger for clicks in relative terms
In GetResponse’s report of 2023 messages, the triggered open rate was 45.38% versus 40.08% for newsletters, a relative difference of 13.2%. The triggered click rate was 5.02% versus 3.84%, a relative difference of 30.7%. These are observational message-type comparisons.
GetResponse, 2024 Email Marketing Benchmarks
The quotient of GetResponse’s two headline averages is 8.20%
GetResponse reports 39.64% average opens, 3.25% average clicks and 8.62% click-to-open. Dividing the two displayed average rates gives 8.20%, about 0.42 points below the separately published click-to-open figure.
GetResponse, 2024 Email Marketing Benchmarks
GetResponse email marketing benchmark, overall displayed average measures. Divide 3.25 by 39.64 and multiply by 100. Compare with the separately displayed 8.62%.
Recorded opens can lower a click-to-open ratio with clicks held fixed
In a worked example, 300 clicks over 3,000 recorded opens gives a 10% click-to-open ratio. The same 300 clicks over 4,500 recorded opens gives 6.67%. Apple documents background loading of remote content regardless of engagement.
Illustrative arithmetic, with Apple Mail Privacy Protection mechanism identified separately. Hold clicks fixed at 300 and divide by the two assumed open counts.
Compare the results
Open and click rankings can point in opposite directions
GetResponse’s platform report covers more than 4.4 billion messages from 2023, sent by active senders with at least 500 contacts. Oceania was 10.36 percentage points above North America on recorded opens. North America was 2.29 points above Oceania on reported clicks, about 1.92 times its click figure. Europe sat between them on clicks at 3.58%, despite a lower open rate than both.
That is a reversal in provider aggregates, not a claim about people in those regions or the quality of any local store. Sender mix, content, email client use, audience intent and reporting methods can all differ. Because the report counts repeat activity, the figures cannot be read as percentages of unique recipients who opened or clicked. In a merchant review, line up the exact unit and reporting policy before comparing two dashboards.
A cart email can still lead to a direct visit or an order on another device without a click in the reporting tool. Keep clicks as a diagnostic signal and tie the main outcome to eligible shoppers and valid orders where possible.
Why a recorded open need not be a human read
Apple explains that Protect Mail Activity downloads remote content in the background by default even when the recipient does not interact with the message. An email service may register the tracking pixel being fetched. That says the remote content was loaded; it does not establish that a person read the email at that time. The mechanism also does not explain every change in the provider data.
The annual comparison illustrates a second interpretive trap. GetResponse reported gains of 12.84 points for opens and 1.36 points for clicks. The implied previous levels were 26.80% and 1.89%. Relative to those different starting levels, the gains were about 47.91% and 71.96%, respectively. The larger absolute change was opens; the larger relative change was clicks. Neither tells the team how much of either change came from a privacy feature.
Record both the earlier value and the measurement unit when discussing year-on-year change. A dashboard with a new mix of clients, senders or messages is not a test in which the only thing that changed was Mail Privacy Protection.
Choose a stronger trigger than an inferred read
The same report showed 45.38% opens and 5.02% clicks for triggered emails, compared with 40.08% and 3.84% for newsletters. Triggered messages begin with a different eligibility event. That difference is a reason to inspect the flow, not evidence that the trigger itself creates the gap. Compare the same kind of flow before and after a change and keep the same rules for who is counted.
For a cart follow-up, confirm that the checkout still exists, the shopper remains eligible for the channel and no paid order has closed it. A reported open is a weak reason to suppress a useful reminder, and an absent open is a weak reason to resend aggressively. A replied question or a validated checkout event provides more specific evidence. Clicks can also contain machine activity, so reconcile them with actual visits or orders when the decision matters.
Show delivered messages, clicks under the same filtering rules, validated purchases and opt-outs in the same report. Add an eligible no-message group if the question is whether the message added purchases. This makes the flow decision resilient to a change in how one engagement event is recorded.
If an open appears after the shopper has already placed the order, use the paid order to stop the recovery flow. The apparent read adds no reason to keep asking someone to finish a checkout they have already completed.
Put triggered-email differences on a common send scale
GetResponse’s 2023 benchmark reported a 45.38% open rate and 5.02% click rate for triggered emails. Newsletters reported 40.08% opens and 3.84% clicks. Applying those rate differences to a normalized 10,000 messages yields 530 more open-rate units and 118 more click-rate units for the triggered category. This is a scale illustration from reported percentages, not a claim about distinct people or true engagement.
Viewed relative to the newsletter rates, the triggered figure is about 13.2% higher for opens and 30.7% higher for clicks. The categories serve different audiences and jobs. That difference cannot show what would happen if the same shopper were moved from a newsletter to a checkout flow, and an automatic privacy load can still change the open count.
When you revise a subject line or checkout offer, keep the comparison inside the same flow and randomize among eligible recipients. Count paid orders and replies per assigned recipient. If the order window is too short or the flow has low volume, clicks can provide a diagnostic signal, especially when they are tied to plausible visits or other actions. Use open data cautiously for delivery diagnostics and avoid counting a triggered-versus-newsletter benchmark difference as a store’s observed change.
The quotient of two published averages need not equal the published click-to-open rate
GetResponse reports average opens of 39.64%, average clicks of 3.25% and click-to-open of 8.62%. Dividing the two displayed headline means produces 8.20%, a 0.42-point difference. The same arithmetic is much closer for the displayed North American and Oceania rows: 10.53% and 4.46%. The overall discrepancy shows why these published summaries cannot all be recomputed from rounded headlines alone. Their aggregation and underlying counts matter.
When comparing two benchmark reports, preserve the publisher’s metric and document how it was calculated. For your own campaign, decide whether the numerator and denominator count unique contacts or raw events, and whether the figure is pooled or averaged across campaigns. Show delivered messages and unique clicks beside the published-style quotient so a change in audience composition does not masquerade as a content improvement.
An account-level average can answer what a typical account reports, while a volume-weighted rate answers what happened per message across the sample. A platform may also calculate a click-to-open ratio separately from its open and click averages. Preserve the published definition, and ask for raw event counts before assuming a disagreement reflects an error.
Background loading can move the ratio with no extra clicks
In a worked example, 300 clicks divided by 3,000 recorded opens gives 10%. If the recorded opens rise to 4,500 and clicks stay at 300, the same ratio falls to 6.67%. The example does not estimate how many real opens were added by Apple. Apple’s documentation explains the mechanism: remote content can load in the background whether or not the recipient engages.
A shopper’s click, reply or return to a saved checkout gives a different signal than an image request. Each event also has blind spots. Some buyers will return directly, and security software can request links without a person choosing them. For a purchase or support decision, validate the strongest available downstream event and test whether the same rule works across mailbox and device groups.
Review purchase joins over an identical time window when changing your trigger. Someone who buys directly after seeing a message can still appear in an assignment-based result. A clicks-only result can miss that purchase. Use the two figures to decide whether better link tracking or a better recovery offer is the work that matters.
Study data
| Measure | Value | Context |
|---|---|---|
| Overall reported opens | 39.64% | Provider-reported aggregate |
| Overall reported clicks | 3.25% | Provider-reported aggregate |
| Overall reported click-to-open rate | 8.62% | Provider-reported aggregate |
| Annual change in reported opens | 12.84 percentage points | Provider-reported aggregate |
| Annual change in reported clicks | 1.36 percentage points | Provider-reported aggregate |
| Oceania reported open rate | 55.66% | Reported opens; can include repeat activity |
| Oceania reported click rate | 2.48% | Reported click-through rate |
| Oceania reported click-to-open rate | 4.46% | Provider-reported click-to-open rate |
| North America reported open rate | 45.3% | Reported opens; can include repeat activity |
| North America reported click rate | 4.77% | Reported click-through rate |
| North America reported click-to-open rate | 10.53% | Provider-reported click-to-open rate |
| Europe reported open rate | 43.25% | Reported opens; can include repeat activity |
| Europe reported click rate | 3.58% | Reported click-through rate |
| Europe reported click-to-open rate | 8.28% | Provider-reported click-to-open rate |
| Newsletters reported open rate | 40.08% | Reported open rate |
| Newsletters reported click rate | 3.84% | Reported click-through rate |
| Triggered emails reported open rate | 45.38% | Reported open rate |
| Triggered emails reported click rate | 5.02% | Reported click-through rate |
| Messages analyzed | More than 4.4 billion messages | Messages sent by GetResponse customers in 2023 |
| Minimum active sender contact list | 500 contacts | Minimum sender list size in the study |
What changes when you compare the figures
| Comparison | Result | Calculation |
|---|---|---|
| Oceania minus North America reported opens | 10.36 percentage points | = 55.66 - 45.30 |
| North America minus Oceania reported clicks | 2.29 percentage points | = 4.77 - 2.48 |
| North America relative to Oceania on reported clicks | 1.92 times | = 4.77 / 2.48 |
| Triggered minus newsletter reported opens | 5.3 percentage points | = 45.38 - 40.08 |
| Triggered minus newsletter reported clicks | 1.18 percentage points | = 5.02 - 3.84 |
| Implied previous reported open rate | 26.8% | = 39.64 - 12.84 |
| Implied previous reported click rate | 1.89% | = 3.25 - 1.36 |
| Annual open increase divided by previous open rate | 47.91 relative % | = 12.84 / (39.64 - 12.84) * 100 |
| Annual click increase divided by previous click rate | 71.96 relative % | = 1.36 / (3.25 - 1.36) * 100 |
| Normalized triggered minus newsletter open-rate units per 10,000 messages | 530 rate units | = (45.38 - 40.08) / 100 * 10000 |
| Normalized triggered minus newsletter click-rate units per 10,000 messages | 118 rate units | = (5.02 - 3.84) / 100 * 10000 |
| Triggered open-rate difference relative to newsletter rate | 13.22 relative % | = (45.38 - 40.08) / 40.08 * 100 |
| Triggered click-rate difference relative to newsletter rate | 30.73 relative % | = (5.02 - 3.84) / 3.84 * 100 |
| Overall click-to-open quotient from the two displayed average rates | 8.2% | = 3.25 / 39.64 * 100 |
| Reported overall click-to-open rate minus quotient of displayed rate means | 0.42 percentage points | = 8.62 - 3.25 / 39.64 * 100 |
| North American click-to-open quotient from its displayed rates | 10.53% | = 4.77 / 45.3 * 100 |
| Oceania click-to-open quotient from its displayed rates | 4.46% | = 2.48 / 55.66 * 100 |
| Click-to-open quotient after modeled inflation in opens at unchanged clicks | 6.67% | = 300 / 4500 * 100 |
Methodology and sources
We transcribed the methodology, regional tables and FAQ values in the 2024 GetResponse report. Its action counting includes repeats and is not converted into a unique-open rate. Differences and ratios use the displayed rounded values. Historical overall levels are reconstructed by subtracting the report’s stated annual percentage-point changes. Apple’s documentation supports the mechanism only. The report does not identify a share of the regional difference caused by Apple or a counterfactual human open rate.
Download the source data (CSV)
Download the calculations (CSV)
Related reading
Abandoned cart email statistics and how to read revenue per recipient
Cart recovery SMS benchmarks for conversion and unsubscribes
Abandoned cart email inbox placement statistics by mailbox provider
Send a Shopify checkout recovery link that opens the right cart
Sources and definitions
GetResponse, 2024 Email Marketing Benchmarks
The source data includes the population, period, denominator and limitations for every figure.