


Quick answer
In Postscript’s 2026 report, abandoned cart SMS had a 3.97% to 7.84% overall conversion interval from the 25th to 75th percentile and an unsubscribe interval of 0.56% to 1.83%. Browse abandonment reported 1.01% to 2.38% conversion alongside 0.59% to 1.80% unsubscribes. Measure both conversion and subscriber loss when deciding where to put the next recovery message.
Key findings and sources
Overall cart SMS conversion and unsubscribe percentiles
Postscript’s 2026 ecommerce SMS report, covering eligible Shopify merchants from January 1 to December 15, 2025, reports 3.97% and 7.84% cart SMS conversion at the 25th and 75th percentiles, and 0.56% and 1.83% unsubscribes at the corresponding percentiles.
Postscript 2026 SMS Benchmarks for Ecommerce Marketing
Cart and browse percentile comparison
In Postscript’s overall 2025 message data, the 75th-percentile conversion was 7.84% for abandoned cart SMS and 2.38% for browse abandonment SMS, a 5.46 percentage-point difference between separate reported distributions.
Postscript 2026 SMS Benchmarks for Ecommerce Marketing
Back-in-stock versus cart trigger
Postscript’s 2026 report shows back-in-stock SMS conversion of 7.18% and 13.80% at the 25th and 75th percentiles, compared with 3.97% and 7.84% for cart SMS in its overall January–December 2025 benchmark. The two triggers reach different recipients.
Postscript 2026 SMS Benchmarks for Ecommerce Marketing
Earnings per message by trigger
Postscript’s overall 25th-percentile earnings per message for its 2025 benchmark was $3.52 for cart SMS, $0.93 for browse SMS and $0.11 for campaigns. The provider reports attributed earnings per message, so the cells do not estimate incremental revenue.
Postscript 2026 SMS Benchmarks for Ecommerce Marketing
Industry variation at the same conversion percentile
Postscript’s 2026 report lists 25th-percentile abandoned cart SMS conversion of 3.83% in Beauty and Cosmetics, 4.40% in Health and Wellness and 5.30% in Outdoor and Sporting Goods, based on eligible merchants’ 2025 results.
Postscript 2026 SMS Benchmarks for Ecommerce Marketing
Conversion and unsubscribe spreads differ by trigger
In Postscript’s 2026 benchmark, the conversion interquartile spread was 3.87 percentage points for cart SMS, 1.37 for browse and 6.62 for back in stock. Unsubscribe spreads were 1.27 points for cart and 0.38 for back in stock. Each distribution is ranked separately.
Postscript 2026 SMS Benchmarks for Ecommerce Marketing
Cart and stock-alert conversion ranges overlapped in the overall benchmark
In Postscript’s 2026 overall table, cart SMS conversion had a 25th-to-75th-percentile range of 3.97% to 7.84%. Back-in-stock SMS ranged from 7.18% to 13.80%. The printed ranges overlap by 0.66 percentage points.
Postscript 2026 SMS Benchmarks for Ecommerce Marketing
Cart SMS led browse on clicks by 2.15 and 3.63 points
In Postscript’s all-industry SMS automation table, cart CTR exceeded browse CTR by 2.15 points at the 25th percentile and 3.63 points at the 75th percentile.
Postscript 2026 SMS Benchmarks for Ecommerce Marketing
Postscript all-industry benchmark, cart and browse flow marginal CTR percentiles. Subtract the displayed browse CTR from cart CTR within each percentile column.
The cart-browse conversion gap exceeded the click gap at both cutoffs
In Postscript’s all-industry SMS table, the cart-browse conversion gaps exceeded the corresponding CTR gaps by 0.81 points at the 25th percentile and 1.83 points at the 75th percentile. These are marginal benchmark contrasts.
Postscript 2026 SMS Benchmarks for Ecommerce Marketing
Postscript all-industry cart and browse automation benchmarks at two percentiles and two metrics. Compute the cart-minus-browse gap for each metric and percentile, then subtract the CTR gap from the conversion gap.
Compare the results
Benchmark the trigger the shopper actually qualified for
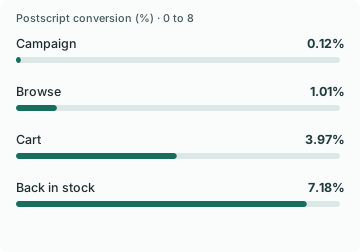
A person who has placed an item in the cart is at a different stage from a visitor who only looked at a product. Postscript’s overall 25th-percentile conversion values were 3.97% for cart, 1.01% for browse and 0.12% for campaigns. Their 75th-percentile figures were 7.84%, 2.38% and 0.54%. Back-in-stock texts had a 7.18% to 13.80% interval, and those messages reach a pool with an inventory event and often a separate request for notification.
A benchmark can help set a question about underperformance. It cannot tell you that reclassifying browse traffic as abandoned cart traffic would produce more orders. Check which event starts the flow, when the record stops being eligible and how many recipients have already received a message from another trigger. In a store with several flows, define which one has priority when the same person moves from browsing to checkout and the two schedules overlap.
Subscriber loss can look similar even when the purchase numbers differ
Cart and browse conversion at the 75th percentile differed by 5.46 percentage points, while their published unsubscribe values differed by 0.03 points at that percentile. These cells describe the provider’s distributions separately. They do not show that a merchant who reaches a certain conversion percentile will see the same unsubscribe percentile. The campaign 75th-percentile unsubscribe value was 0.88%, compared with 1.83% for cart. Keep your own thresholds by trigger and monitor the total across the channel too.
If you add a second text, do not count the first send’s conversions as evidence for the additional contact. Randomize the second send among shoppers still eligible at that point, retain the assignment, and compare valid orders and unsubscribes over the same follow-up window. Use unique subscribers for the list-loss review where repeated contacts would otherwise count the same person multiple times. In parallel, track provider message events under the benchmark definition so the comparison stays interpretable.
Read earnings per message with its original denominator
At the 25th percentile, reported earnings per message was $3.52 for cart, $0.93 for browse and $0.11 for campaigns. The cart and browse gap was $2.59 per message. This compares vendor attribution metrics for different recipients, volumes and purchase intent. It does not estimate how much cash a merchant would earn by shifting the same audience into a different flow. It is also different from earnings per recipient when people receive multiple messages.
For the rollout decision, measure valid orders and contribution per eligible shopper and account for any offer cost and list loss. Record your checkout trigger, the assignment and each attempted send. A shopper who purchases before the second scheduled contact should still be counted in the group they were assigned to, even when suppression prevents the message. A report that uses only actual recipients can introduce a selection effect if the timing rules remove shoppers at different rates.
Compare with a relevant industry before diagnosing a weak flow
The 25th-percentile cart conversion was 3.83% in Beauty and Cosmetics, 4.40% in Health and Wellness and 5.30% in Outdoor and Sporting Goods. That 1.47-point difference between outdoor and beauty benchmarks uses the same column across separate groups. It is useful as context for the questions you ask about a program and does not demonstrate that changing sectors would change a store’s conversion rate.
When a comparison looks weak, check whether the flow is actually reaching people who left an eligible checkout and whether it sends within the intended window. Then check purchase attribution and the message itself. A cart that has been paid, has a failed payment, or contains an unavailable item may need different handling. For an unresolved shopper question, use a reply that addresses the verified obstacle. Test that message with the same eligibility rules and read incremental orders and opt-outs together.
Make the comparison in two stages. First, check that the right shoppers reached the flow. Then compare their outcomes with a valid holdout. Segment any post-purchase clicks or delayed orders so reporting does not count a new need as resolution of the original abandoned checkout.
Compare spread as well as where the benchmark sits
Postscript reports overall cart SMS conversion from 3.97% at the 25th percentile to 7.84% at the 75th, an interquartile spread of 3.87 percentage points. Browse spans 1.37 points and back in stock spans 6.62 points. The larger back-in-stock spread does not tell you which individual shops perform better on two flows at once. It shows that a single midpoint hides more dispersion for this reported conversion group.
The unsubscribe comparison points in a different direction. The cart span is 1.27 points and back in stock is 0.38 points. Percentiles for conversion and unsubscribes are ranked separately, so do not pair a 75th-percentile conversion with a 25th-percentile unsubscribe figure as though it describes one typical high performer.
For a merchant’s own weekly review, place conversion and unsubscribes in two columns and keep the same rule for eligible sends and the same outcome window. If volume is low, keep the numerator beside the rate so one order or opt-out does not look like a systematic change. Compare like-for-like triggers rather than imposing the cart range on browse or a stock alert. A wide provider interval is a reason to look at store-specific conditions, such as category, timing and deliverability, before choosing what to change.
Budget a requested stock alert separately from a cart nudge
Postscript’s 2026 overall table put back-in-stock text conversion at 7.18% to 13.80% between the 25th and 75th percentiles. Cart text ran from 3.97% to 7.84%. Their published ranges overlap from 7.18% to 7.84%, a width of 0.66 percentage points. That overlap describes the printed intervals and does not tell you how often a given cart flow beats a given stock alert.
The two message types also look different on the unsubscribe side. At the upper overall percentile, the reported cart benchmark was 1.83% and back in stock 0.83%, a one-point difference. At the upper earnings-per-message percentile, the reported values were $10.95 and $13.34, a $2.39 gap. These columns are separate percentile distributions. They cannot be put together to describe one representative account.
For a store, an explicit request to learn when a specific item comes back is a different customer action from leaving a cart. Keep those contact rules distinct. Monitor opt-outs by flow and by message step, and check whether the later cart reminder reaches people who have already received a requested alert. Use your own consent and preferences before sending either message. When estimating the additional value of a change, measure purchase, contribution and opt-outs in the same eligible population.
Clicks and conversions separate cart and browse flows by different amounts
In Postscript’s all-industry table, cart exceeds browse by 2.15 points in the 25th-percentile click benchmark and 3.63 points at the 75th percentile. The published conversion gaps at those percentiles are 2.96 and 5.46 points. Each gap compares two flow-specific benchmarks at the same reported percentile. A large purchase difference can coexist with a smaller difference in the upstream click measure.
The click and conversion percentiles are separate distributions. Dividing a percentile conversion rate by the matching percentile click rate cannot recover conversion among those clickers. For example, there is no reason the store at the 75th percentile on conversion is the store at that percentile on clicks. The comparison identifies two benchmark gaps, leaving the route from click to purchase unmeasured.
For a storefront readout, use mutually exclusive trigger states or specify how overlapping eligibility is resolved. One shopper can browse, add to cart and click an SMS in a short period. Assigning the resulting order to both flows may make both messages appear more productive without changing what the customer bought.
Instrument the exact checkout problem behind the text
Use a consistent assignment identifier, the actual click event, the resulting checkout, and the paid order. Keep customers who never click in the randomized treatment group. If clicks rise but paid orders do not, inspect the landing page, applied promotion, payment retry and variant availability. If clicks stay flat but completed orders rise, check for direct returns and attribution overlap before changing the copy.
Give an explicitly requested back-in-stock alert its own eligibility rule. A buyer asking for a specific variant is doing something different from someone who browsed a collection and left. If the merchant changes both the eligible group and the message, report that policy comparison as a whole. For a copy-only decision, keep the trigger and follow-up window constant.
An operator can test the reported gaps with two distinct views: what happened per assigned shopper and what the tracked click actually opened. An invalid discount or a landing page with the wrong saved variant may leave the first view unchanged and show up clearly in the second. Keep both views in the pilot.
Study data
| Measure | Value | Context |
|---|---|---|
| Cart SMS conversion, 25th percentile | 3.97% | As labeled in the provider’s overall message table |
| Cart SMS conversion, 75th percentile | 7.84% | As labeled in the provider’s overall message table |
| Cart SMS unsubscribe, 25th percentile | 0.56% | As labeled in the provider’s overall message table |
| Cart SMS unsubscribe, 75th percentile | 1.83% | As labeled in the provider’s overall message table |
| Cart SMS earnings per message, 25th percentile | $3.52 | As labeled in the provider’s overall message table |
| Browse SMS conversion, 25th percentile | 1.01% | As labeled in the provider’s overall message table |
| Browse SMS conversion, 75th percentile | 2.38% | As labeled in the provider’s overall message table |
| Browse SMS unsubscribe, 25th percentile | 0.59% | As labeled in the provider’s overall message table |
| Browse SMS unsubscribe, 75th percentile | 1.8% | As labeled in the provider’s overall message table |
| Browse SMS earnings per message, 25th percentile | $0.93 | As labeled in the provider’s overall message table |
| Back in stock SMS conversion, 25th percentile | 7.18% | As labeled in the provider’s overall message table |
| Back in stock SMS conversion, 75th percentile | 13.8% | As labeled in the provider’s overall message table |
| Back in stock SMS unsubscribe, 25th percentile | 0.45% | As labeled in the provider’s overall message table |
| Back in stock SMS unsubscribe, 75th percentile | 0.83% | As labeled in the provider’s overall message table |
| Back in stock SMS earnings per message, 25th percentile | $5.92 | As labeled in the provider’s overall message table |
| Campaign SMS conversion, 25th percentile | 0.12% | As labeled in the provider’s overall message table |
| Campaign SMS conversion, 75th percentile | 0.54% | As labeled in the provider’s overall message table |
| Campaign SMS unsubscribe, 25th percentile | 0.33% | As labeled in the provider’s overall message table |
| Campaign SMS unsubscribe, 75th percentile | 0.88% | As labeled in the provider’s overall message table |
| Campaign SMS earnings per message, 25th percentile | $0.11 | As labeled in the provider’s overall message table |
| Beauty and cosmetics cart conversion, 25th percentile | 3.83% | Sector-specific 25th percentile of conversion in the published table |
| Health and wellness cart conversion, 25th percentile | 4.4% | Sector-specific 25th percentile of conversion in the published table |
| Outdoor and sporting goods cart conversion, 25th percentile | 5.3% | Sector-specific 25th percentile of conversion in the published table |
| Cart SMS CTR at the 25th percentile | 9.53% | Marginal percentile benchmark. Different metric percentiles need not identify the same stores. |
| Cart SMS CTR at the 75th percentile | 17.28% | Marginal percentile benchmark. Different metric percentiles need not identify the same stores. |
| Browse SMS CTR at the 25th percentile | 7.38% | Marginal percentile benchmark. Different metric percentiles need not identify the same stores. |
| Browse SMS CTR at the 75th percentile | 13.65% | Marginal percentile benchmark. Different metric percentiles need not identify the same stores. |
| Measure | Value | Context |
|---|---|---|
| Cart SMS earnings per message, 75th percentile | $10.95 | Reported upper overall earnings-per-message percentile |
| Back in stock SMS earnings per message, 75th percentile | $13.34 | Reported upper overall earnings-per-message percentile |
What changes when you compare the figures
| Comparison | Result | Calculation |
|---|---|---|
| Cart minus browse conversion at the 25th percentile | 2.96 percentage points | = 3.97 - 1.01 |
| Cart minus browse conversion at the 75th percentile | 5.46 percentage points | = 7.84 - 2.38 |
| Cart minus browse unsubscribe at the 75th percentile | 0.03 percentage points | = 1.83 - 1.80 |
| Cart versus campaign 75th-percentile unsubscribe thresholds | 2.08 times | = 1.83 / 0.88 |
| Cart minus browse 25th-percentile earnings per message | 2.59 USD per message | = 3.52 - 0.93 |
| Outdoor versus beauty cart conversion at the 25th percentile | 1.47 percentage points | = 5.30 - 3.83 |
| Cart conversion interquartile spread | 3.87 percentage points | = 7.84 - 3.97 |
| Browse conversion interquartile spread | 1.37 percentage points | = 2.38 - 1.01 |
| Back-in-stock conversion interquartile spread | 6.62 percentage points | = 13.80 - 7.18 |
| Cart unsubscribe interquartile spread | 1.27 percentage points | = 1.83 - 0.56 |
| Back-in-stock unsubscribe interquartile spread | 0.38 percentage points | = 0.83 - 0.45 |
| Overlap of reported cart and back-in-stock conversion intervals | 0.66 percentage points | = 7.84 - 7.18 |
| Upper-percentile cart minus back-in-stock unsubscribe rate | 1 percentage points | = 1.83 - 0.83 |
| Upper-percentile back-in-stock minus cart earnings per message | 2.39 USD per message | = 13.34 - 10.95 |
| Cart minus browse CTR at the 25th percentile | 2.15 percentage points | = 9.53 - 7.38 |
| Cart minus browse CTR at the 75th percentile | 3.63 percentage points | = 17.28 - 13.65 |
| At p25, size of conversion gap above CTR gap | 0.81 percentage points | = (3.97 - 1.01) - (9.53 - 7.38) |
| At p75, size of conversion gap above CTR gap | 1.83 percentage points | = (7.84 - 2.38) - (17.28 - 13.65) |
Methodology and sources
We read the overall Messaging Benchmarks table and the named industry tables in the Postscript 2026 report. The report covers January 1 to December 15, 2025 and references more than 17,000 Shopify stores. Its eligibility rule requires installation 90 days before Black Friday and at least $100 of marketing spend in the third quarter. The report does not give a merchant or message count for each displayed cell. We retain its 25th and 75th percentile labels and compare published thresholds as independent values. Conversion, unsubscribe and earnings per message are distinct outcomes. Ratios between thresholds are descriptive and cannot identify incremental sales or the behavior of a single merchant.
Download the source data (CSV)
Download the calculations (CSV)
Related reading
Abandoned cart email statistics and how to read revenue per recipient
Email open rate statistics and what Mail Privacy Protection changes
Abandoned cart email inbox placement statistics by mailbox provider
Send a Shopify checkout recovery link that opens the right cart
Sources and definitions
Postscript 2026 SMS Benchmarks for Ecommerce Marketing
The source data includes the population, period, denominator and limitations for every figure.